Github repo to reproduce all the maps and analysis in this post using R
In February 2014, 39,000 tons of toxic coal ash leaked into the Dan River in North Carolina. From the EPA’s case summary of the incident:
The coal ash that was released into the Dan River contains unburned carbon and various metals including arsenic, cadmium, chromium, copper, lead, mercury, nickel, selenium and zinc.
The Dan River was (and is) used for crop irrigation, recreation and drinking water for nearby residents. In the wake of this disaster, new regulations on the handling and storage of coal ash went into effect. However, many environmental regulations have recently been rolled back, and those governing coal ash have not escaped the current administration’s attention. The public health consequences of coal ash disposal might, unfortunately, become freshly relevant.
What is coal ash?
Coal ash is the residual waste generated by burning coal. Ideally, coal ash is reused to produce concrete or wallboard, but it’s often dumped into waterways or mixed with water and stored in landfills or designated ponds. Storage mechanisms are imperfect, sometimes bursting open or silently leaking pollutants into the water table below. Coal ash that is not mixed with water remains aerosolized and poses inhalation risks. A 2018 meta-study of the health risks associated with coal ash concluded that:
[P]eople living in close proximity to coal-fired plants had higher rates of all-cause and premature mortality, increased risk of respiratory disease and lung cancer, cardiovascular disease, poorer child health, and higher infant mortality. The elevated health risk was associated with exposure to air pollutants from the power plant emissions and to a spectrum of heavy metals and radioactive isotopes in coal ash.
Who bears these health burdens? A long line of academic literature has found that poor, non-white or otherwise marginalized communities suffer disproportionately from elevated pollution levels. Consistent with these findings, I present evidence here that larger volumes of coal ash are stored in counties with higher proportions of Black residents. This disparity, however, varies significantly by state, so I include some state-specific results in addition to results at the national level.
What I did
I use two kinds of data for this analysis. First, I collect demographic data on the residents of each US county. I combine this with data on the location and size of coal ash storage locations throughout the country.
I draw demographic data from the US Census Bureau’s most recent American Community Survey. I also pull data on county land area from the Census, which I used to construct population density for each county.
Finding the locations of coal ash storage facilities was more difficult. The EPA requires energy companies to post coal ash storage data online. While the EPA does not compile that data into a single useful source, it does host a list of online postings. Fortunately, Earthjustice—the Sierra Club’s legal defense arm—recently collated data from each of those online postings and published a comprehensive data set here.
Using these data sources, I plot the locations of each known coal ash containment site and run several regressions to determine the relationship between a county’s black population and the quantity of coal ash stored in that county.
What I found
The map below shows the locations of 773 coal ash storage sites and the proportion of each county that identifies as Black or African-American (alone or in conjunction with one or more races). Larger red dots indicate a larger volume of stored coal ash.
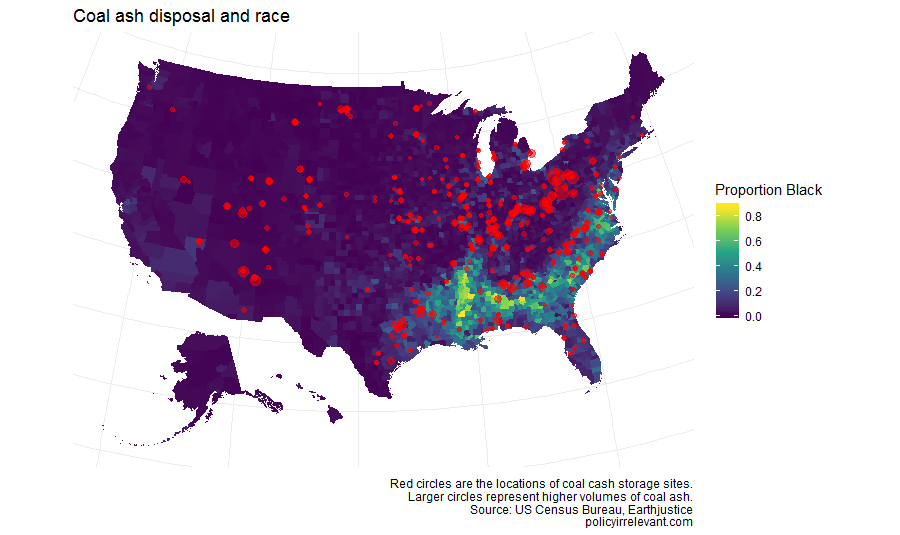
The US’s Black population is heavily concentrated in the southeastern states and along the mid-Atlantic coast, and while there are many coal ash sites in the southeast, there appear to be more (and larger) coal ash sites in less-Black regions to the north. It’s not immediately clear from the map that Black Americans face disproportionate exposure to coal ash, so let’s look at the numbers.
About 19.8% of Black Americans live in a county where coal ash is stored. For all Americans, that number is 14.9%, so Black citizens are about 33% more likely than average to live in a coal ash county. Let’s consider a few explanations for this disparity.
First, income. People don’t want coal ash stored in their backyards, but effective NIMBYism requires financial wherewithal. If Black Americans have lower average incomes, they may be less able to oppose the construction of nearby coal ash sites.
Second, the urban/rural divide. Black Americans are more likely than average to live in urban areas. Power plants have an incentive to locate near the largest number of customers to reduce infrastructure costs. Similarly, coal ash is often stored near the power plant that produced it. As a result, both Black populations and coal ash sites may tend to localize around population-dense areas.
Fortunately, we can control both for income and for population density to test each of these explanations. Below are the results of three OLS regressions.
| Dependent variable: Coal ash volume (log) | |||
| (1) | (2) | (3) | |
| Proportion Black | 6.101** | 6.413** | 6.131** |
| (2.606) | (2.629) | (2.954) | |
| Median income | 0.011 | 0.009 | |
| (0.012) | (0.015) | ||
| Population density (log) | 0.036 | ||
| (0.156) | |||
| Constant | 3.540* | 2.954 | 2.916 |
| (2.016) | (2.066) | (2.061) | |
| Note: | *p<0.1; **p<0.05; ***p<0.01 | ||
These regressions each take a county as the unit of observation. The outcome variable is the log of the total volume of coal ash stored in each county (measured in cubic yards). The variable of interest (proportion of the county’s population that identifies as Black or African American) is significantly and positively related to the outcome variable in all three regressions. Notably, controlling for the counties’ median income and population density does not decrease the strength of this relationship. This effectively rules out the above explanations.
Aside: In each of these regressions I also include state fixed effects. The results differ only slightly if fixed effects are excluded. Standard errors are HC1 cluster-robust. Counties are weighted by population. Unweighted results are significant (p<.01) but are much smaller in magnitude.
Median income is measured in thousands of dollars. Population density is measured in persons per square mile.
N=3142 for regressions (1) and (2). Land area data is missing for 8 counties, so N=3134 for regression (3).
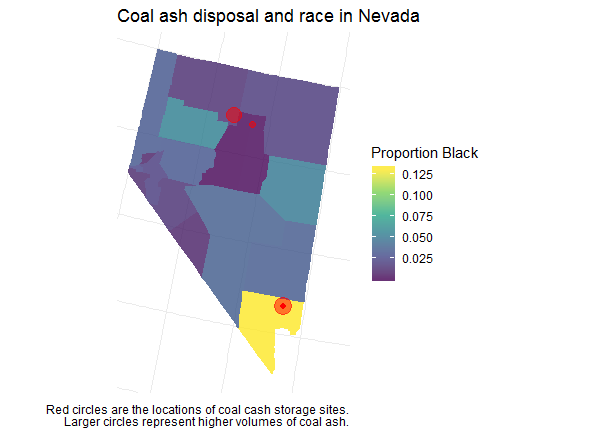
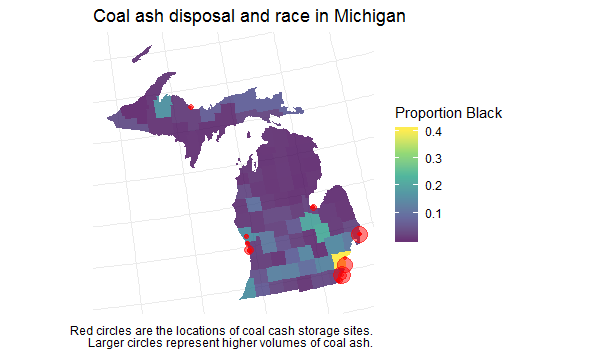
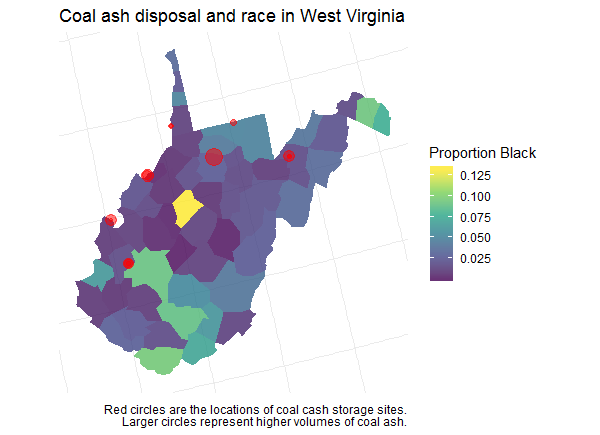
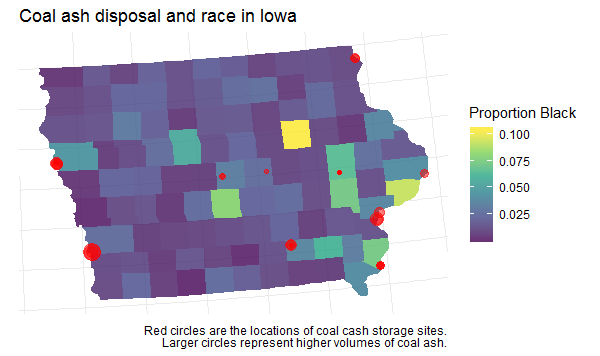
I also ran the above regressions separately for each state containing at least one coal ash site. In Nevada and Michigan, coal ash sites are highly likely to be located in high-Black-population counties. Interestingly, in two states—Iowa and West Virginia—coal ash sites are more likely to be located outside of counties with high black populations. I present regression tables and maps for each of these states at the end of the post.
I’d like to note here that, although I present evidence against the income and population density explanations, I am unable to establish that any particular explanation is correct. Some alternatives I can think of (but don’t presently test):
- Coal ash deposits drive down house prices and Black Americans are more price sensitive with respect to housing than Americans of other races, so they are more likely to move in nearby (or less likely to move away).
- Black Americans are less informed about the presence or danger of coal ash sites, and so are less deterred from living nearby.
- Black Americans have less political capital than other Americans because of centuries of institutionalized racism, low representation in state and local governments, and high rates of incarceration and disenfranchisement. Power companies know this and locate their toxic effluent where they will not be effectively opposed.
I have an opinion about which of these is most likely, but the truth is probably a mix of several factors. I’d love to see someone connect these results with data on red-lining, geographical mobility by race, and the specific timing of when these coal plants were established.
Conclusion
I find preliminary evidence that Black Americans are significantly more likely to live in close proximity to coal ash storage sites. My methodology—OLS regressions on observations at the county level—is unable to establish the cause of this disparity but does provide confirmation that the burden of coal ash pollution, like many other forms of pollution, is borne disproportionately by Black communities.
Selected state-specific results
While there is a significant positive correlation between black population and coal ash storage volume in the US as a whole, that correlation varies widely between states. Below are results for states with the strongest positive (Nevada and Michigan) and negative (West Virginia and Iowa) associations between Black populations and coal ash containment volumes by county. The regressions are run with exactly the same specifications as in the US case, with the exception of state fixed effects.
To generate results for other states, the Github repo for this post includes everything you need.
Nevada
| Dependent variable: Coal ash volume (log) | |||
| (1) | (2) | (3) | |
| Proportion Black | 149.128*** | 153.359*** | 159.857*** |
| (8.265) | (7.691) | (12.896) | |
| Median income | 0.132 | 0.124 | |
| (0.087) | (0.088) | ||
| Population density (log) | -0.335 | ||
| (0.503) | |||
| Constant | -3.738*** | -11.541** | -10.047** |
| (1.071) | (4.655) | (3.950) | |
| Note: | *p<0.1; **p<0.05; ***p<0.01 | ||
Michigan
| Dependent variable: Coal ash volume (log) | |||
| (1) | (2) | (3) | |
| Proportion Black | 35.208*** | 31.997*** | 41.689*** |
| (10.466) | (9.015) | (14.811) | |
| Median income | -0.118 | -0.052 | |
| (0.073) | (0.119) | ||
| Population density (log) | -0.906 | ||
| (0.956) | |||
| Constant | -0.967 | 5.918 | 6.320 |
| (1.710) | (3.886) | (4.000) | |
| Note: | *p<0.1; **p<0.05; ***p<0.01 | ||
West Virginia
| Dependent variable: Coal ash volume (log) | |||
| (1) | (2) | (3) | |
| Proportion Black | -49.507** | -71.960*** | -89.155** |
| (21.725) | (26.035) | (35.272) | |
| Median income | 0.256* | 0.179 | |
| (0.145) | (0.138) | ||
| Population density (log) | 1.614 | ||
| (1.354) | |||
| Constant | 4.946*** | -5.474 | -8.928 |
| (1.843) | (5.444) | (5.825) | |
| Note: | *p<0.1; **p<0.05; ***p<0.01 | ||
Iowa
| Dependent variable: Coal ash volume (log) | |||
| (1) | (2) | (3) | |
| Proportion Black | -0.312 | 4.466 | -151.567** |
| (27.434) | (25.756) | (59.450) | |
| Median income | -0.129 | -0.401*** | |
| (0.095) | (0.130) | ||
| Population density (log) | 4.791** | ||
| (2.071) | |||
| Constant | 3.140*** | 10.278* | 10.452 |
| (1.178) | (5.687) | (6.383) | |
| Note: | *p<0.1; **p<0.05; ***p<0.01 | ||